The Docs Site's Interactive Section and the Licences Behind the Tor Relay Globe
On this page
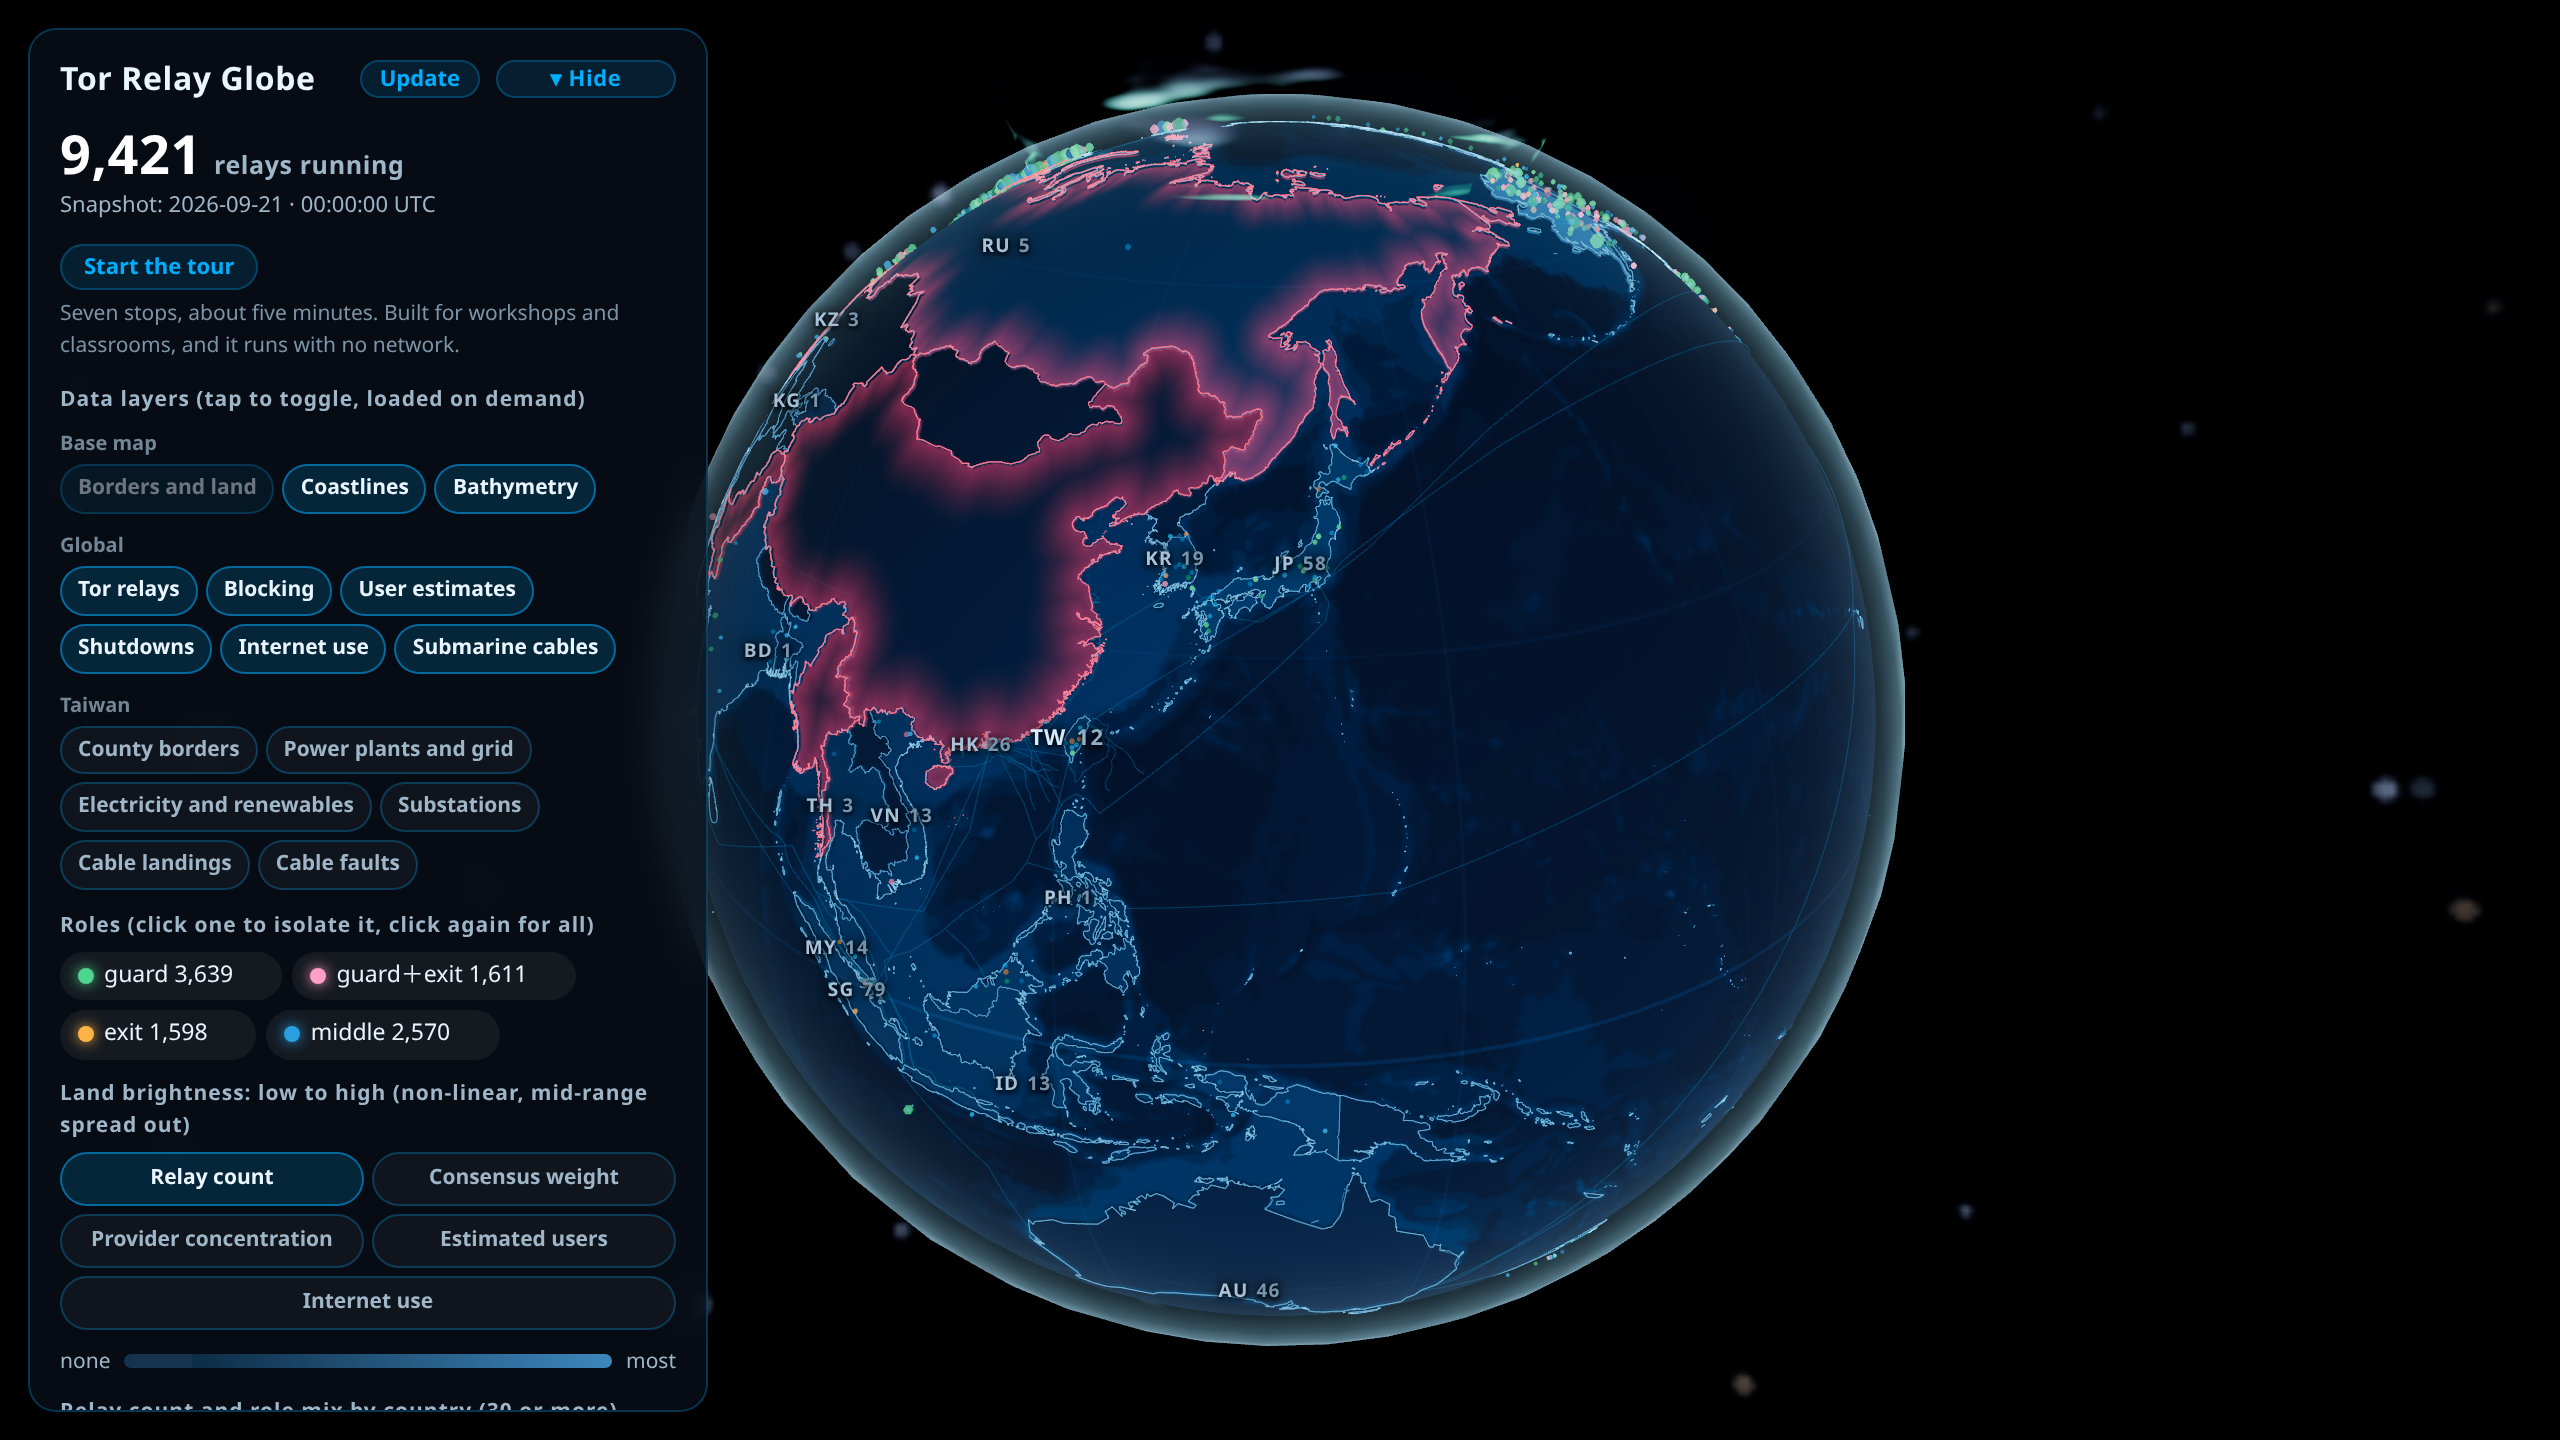
The docs site now has an Interactive section holding three pieces, all centred on Tor. The one carrying the most data is the Tor Relay Globe, which plots nearly ten thousand running relays onto a sphere. Over sixty percent of them sit in the United States, Germany and the Netherlands.
Building it meant checking more than twenty public datasets, and six made it in. The APIs mostly worked and the formats were clean. Almost every dataset we lost was lost to terms that do not allow redistribution.
The Case for a Visual
Anonymity network infrastructure is hard to describe in prose, and the difficulty lies in sequence and scale.
On sequence, Tor is the obvious example. A packet advances through three relays, shedding one layer of encryption at each hop, and only at the exit is the original request restored. Which layer comes off at which hop, and what each stop gets to see, all follow from that order. However carefully the text is written, a reader still has to animate the packet's journey in their own head, and no two readers produce quite the same version.
Scale is harder still. "Nearly ten thousand relays, heavily concentrated in a handful of countries" is a sentence you read past. Plot every relay onto a globe and North America and Western Europe merge into one band of light, while everywhere else shows a scattering of dots. With the same numbers turned into a picture, readers do not have to trust our adjectives and can judge for themselves.
The Six Datasets Behind the Globe
| Data | Source | Licence |
|---|---|---|
| Relay distribution | Onionoo | CC0 1.0 |
| User and bridge counts | Tor Metrics | CC0 1.0 |
| Connection-blocking measurements | OONI | CC BY-NC-SA 4.0 |
| Shutdown records | Access Now KeepItOn | CC BY 4.0 |
| Submarine cables | OpenStreetMap contributors | ODbL 1.0 |
| Borders and coastlines | Natural Earth | public domain |
The Onionoo snapshot is distilled down to country-level aggregates, with no fingerprints, nicknames, IP addresses or contact details. ASN registration names are filtered as well, because an AS registered by an individual carries that person's legal name in the RIR record. For someone running a relay in a heavily censored country, publishing that name would tie the relay to the name on their ID.
Landmass brightness switches between four metrics. Relay count is the obvious one. Consensus weight shows the share of traffic a country actually carries, which often diverges from the raw count. Single-provider concentration is the fraction of a country's relays sitting with its largest hosting provider: the higher it goes, the more that country's anonymous traffic depends on one facility staying up and staying cooperative. The user estimate is a demand-side figure, and the gap between it and the three supply-side metrics is itself informative.
Three Datasets Added on 2026-07-31
Three more datasets went into the globe after this post was published, checked against the same licence standard.
| Data | Source | Licence |
|---|---|---|
| Share of population online | World Bank | CC BY 4.0 |
| Same figure for Taiwan | Ministry of Digital Affairs National Digital Access Survey | Open Government Data Licence, version 1 |
| Sea floor depth | Natural Earth | public domain |
The share of population online serves as a denominator. The globe used to show only how many people use Tor in each country, and that number largely tracks population size. Knowing what share of a country is online at all is what lets you tell whether a gap between two countries comes down to one of them simply having fewer people online.
Taiwan is not among the 217 economies in the World Bank figures, an awkward gap for a site run by a community based in Taiwan. Taiwan's figure comes from the Ministry of Digital Affairs survey instead. The two use different methods, one is ITU compiling national reports and the other is a telephone survey of people aged 12 and over, and the globe notes that they should not be compared directly. The gap comes from data politics rather than licensing, and it lands on downstream users just the same.
Sea floor depth comes from the same source as the borders, so there was no new licence to handle. The globe uses four contours at 200, 1000, 3000 and 5000 metres, the shallowest of which is the continental shelf. With it in place the cable layer starts to explain something. Submarine cables mostly follow the shelf and avoid the deep basins, and with both layers up you can see why the cables run where they do.
That led to looking for cable landing points, the most fragile part of any cable and a closely watched topic for Taiwan. OpenStreetMap does not hold them at all: a taginfo query for man_made=cable_landing_point, seamark:type=landing_point and three other candidate tags returns 0 worldwide for every one of them. Landing point coordinates are part of the TeleGeography product just as the cable geometry is, so they sit behind the same terms. (October 2026 note: the globe later added a self-built dataset of 14 landing points in Taiwan, using the Ministry of Digital Affairs' public cable list as the backbone and cross-checking each coordinate. Details are on the Tor Relay Globe page.)
Deliberate Restraint in What Gets Drawn
OONI's data shows the trade-off best. It gives a per-country anomaly rate for the Tor test, and the numbers look like enough to draw a global censorship map, but the middle of the range is measurement noise. Switzerland measures 22.2%, Canada 21.2%, New Zealand 41.1%, and none of these countries has a censorship problem. Colouring the mid-range would amount to accusing them on the strength of noise.
The globe therefore marks only countries above an 85% anomaly rate with a sufficient sample, leaves everything below uncoloured, and keeps the wording at "did not complete as expected". The 85% threshold comes from no formula. We looked at the distribution and picked it. Noise tops out around forty percent, so 85% leaves enough distance, and we would rather miss a few genuinely blocked countries than paint a clean one red.
Access Now's shutdown records work the other way round. Every entry is verified by hand and its cause is known, so the globe can state plainly that a deliberate shutdown happened there. Outages caused by armed conflict or communal violence do not necessarily follow a government decision and may come from damaged infrastructure, so those are presented separately from information-control cases.
The same reasoning led us to drop V-Dem's digital society indicators. The licence would have allowed it, but each country-year is scored by around five experts and converted into a continuous scale by a statistical model. Painting expert scores onto a map would put our rendering behind one organisation's political judgement.
Datasets We Could Not Use
Submarine Cables
The first candidate was TeleGeography's Submarine Cable Map, the authoritative dataset in this field, until it turned out that TeleGeography now sells the coordinates as a product. License TeleGeography's Map Data is an annual licence delivering GeoJSON over Amazon S3 or an API, pushed automatically on every update. The GeoJSON is the product.
Taiwan's submarine cable map took the pragmatic route for unclear licensing. The code is MIT-licensed and open, while the geometry lives in a separate repository that returns 404, and the main repo's README simply says "You can leave the folder empty".
The cables on our globe ultimately come from routes mapped by OpenStreetMap contributors, 228 segments in all. Coverage is best across Europe, the Mediterranean and the Atlantic, and the middle of the Pacific is close to empty. In an OSM mailing list thread from 2011, someone proposed folding TeleGeography's data into OSM. A community member's reading was that the licence forbids commercial use and derivatives, making it incompatible with ODbL, and the proposal went nowhere. Fifteen years later the middle of the Pacific is still empty.
Network Infrastructure
This whole category came back nearly empty, and for similar reasons.
RIPE Atlas probe data is good quality: querying in July 2026 returned close to sixty thousand probes worldwide with coordinates and ASNs, straight from the API. The service terms state that commercial use requires separate permission from the RIPE NCC, and there is no open licence declaration. PeeringDB's API works just as well, but its acceptable use policy forbids bulk redistribution to third parties. Packet Clearing House's IXP directory is CC BY-NC-SA 3.0 and Cloudflare Radar is CC BY-NC 4.0, and both non-commercial clauses would extend to our content.
IODA is the one we regret most. It detects national outages from BGP withdrawals, active probing and darknet traffic anomalies, which makes it real measurement and a close fit for this site. The API returns data, and the response itself carries the line Copyright (c) 2021-2025 Georgia Tech Research Corporation. All Rights Reserved.
Datasets with no terms at all are another category. The RIRs' delegated stats files download fine and open with nothing but a disclaimer, not one word about licensing. The root-servers.org node list has JSON endpoints, and the site carries no licence declaration anywhere. Silence cannot be read as permission, and it is harder to handle than an explicit prohibition because there is nothing to base a judgement on.
Index Datasets
Freedom House's Freedom on the Net and Reporters Without Borders' (RSF) Press Freedom Index are the two most frequently cited, and neither is usable. RSF's licence is CC BY-ND, which forbids derivatives, so converting it to JSON and re-presenting it would breach the terms. Freedom House publishes no licence statement on its site, and obtaining the data means writing to ask.
No Individual Licence Requests
Standard practice in open-data circles is to read the terms and then email anyway, since non-profit or research exemptions are often available. With the organisations above, we deliberately did not.
What the globe set out to learn is what a downstream reuser actually runs into. Solving each blocked dataset through individual negotiation would have produced a handful of friendly replies, with no answer about how welcoming open data is to anyone who wants to build on it. The terms as written are what the overwhelming majority of people meet. Someone with no contacts, no institutional backing, and just an idea sees that one page of terms and nothing else, so this post records only the terms.
Open APIs Versus Open Data
We expected the difficulty to be technical. Instead most endpoints worked and most formats were clean, everything blocked at the terms, and an open API turned out to be a different thing from open data. The default posture at the RIRs, CAIDA, the RIPE NCC and PeeringDB is that you may look and you may research, but you may not carry it away wholesale, which is a different culture from Tor Metrics, OONI and Natural Earth. Datasets with no licence statement at all count here too, since in practice they are unusable. Plenty of tools in the industry do use those files, but each of them absorbs that risk privately, and a publicly published docs site cannot do the same.
The docs site's architecture leaves no room for hoping it is probably fine either. The site is static, the data files ship as they are, and they get pushed to IPFS. Content-addressed data cannot be recalled once it is out, and mirrors can persist indefinitely.
On the other side, the globe exists largely because the Tor Project released Onionoo and Tor Metrics as CC0 and Natural Earth is public domain. Those decisions may have been a single line of configuration at the time, yet more than a decade later an unrelated community can pick the data up directly, with no licensing correspondence and no worry about being asked to take it down.
OONI's data is CC BY-NC-SA 4.0, and the ShareAlike term is incompatible with this site's CC BY 4.0. The handling is to keep ooni.json as its own file, never merging its contents into the other data files and only presenting it alongside the other sources, so that the whole qualifies as a collection under the CC definition and ShareAlike stops at that one file. NOTICE records that premise, so that nobody later merges an OONI field into the relay snapshot and pulls the entire derivative under ShareAlike.
The Other Two Pieces
Tor Routing Puzzle has you pick three relays to form a guard, middle and exit path, avoiding surveilled nodes, spreading the hops across different ASNs, and switching to bridges when blocked. Watching a circuit fail because all three hops landed in the same ASN sticks better than reading "spread them out" ten times.
Tor Traffic Flow uses glowing particles to show the difference between two paths. Connecting to a .onion service has both sides build a three-hop circuit and meet at a randomly chosen rendezvous point. Connecting to the clear web runs three hops out to an exit and back the same way.
All three pieces run in the browser with three.js, need no install, and support Traditional Chinese, Simplified Chinese and English. The source lives in anoni-net/docs under docs/zh-TW/games/, with no build step, so you edit a file, save, and reload.
If you have an idea, come find us in the community and build one with us.