OONI Run v2 Usage Patterns, a Census of 336 Links

OONI Run v2 has produced 14.17 million measurements worldwide, and 72% of them come from three lists. The highest-volume lists all work the same way: each one targets a single censorship or blocking phenomenon, and a continuously running measurement backend executes it on a schedule, accumulating data over time. We surveyed every Run v2 link to measure how concentrated the usage is, and to draw out what the pattern offers communities that want to run their own local connectivity observation.
OONI Run v2 lets anyone compose a list of websites, generate a link from it, and have others run that list with one tap in OONI Probe, with every result going into OONI's public dataset (the OONI Run v2 guide on the docs site covers how to use it). It lets you define your own measurement targets without writing code, yet few people know the feature or have used it, so we wanted to see how it is actually used.
Method
We took a snapshot on 2026-06-01 and went through all 336 live OONI Run v2 links, pulling each link's lifetime measurement count from OONI's aggregation API1 and grouping the links by list topic. Every figure below is based on that snapshot; the data source and caveats are at the end.
Population size
From the first link on 2024-04-24 to the snapshot date, about 26 months, only 337 Run v2 links were created worldwide (one has since been deleted, leaving 336). Creation spiked between October and December 2024 and has since held steady at 10 to 19 a month. 157 distinct authors took part, and 332 links use Web Connectivity, almost all of them testing website reachability.
New Run v2 links created per month
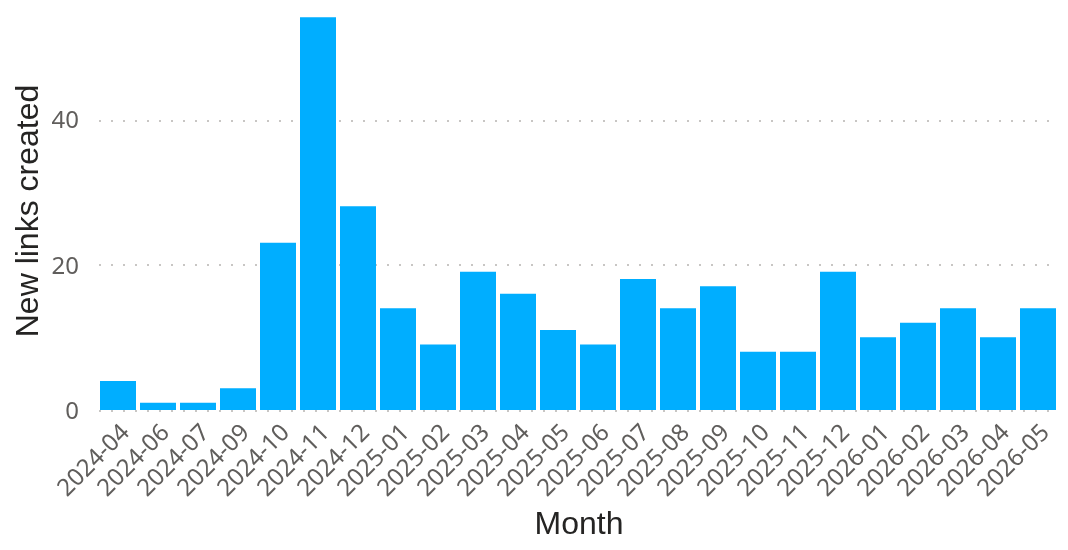
For a global censorship-observation tool, 337 links in two years is not many, and going by creation count alone it is easy to conclude that almost nobody uses Run v2. The usage data in the next section contradicts that.
Concentration of usage
The lifetime measurements of all 336 links add up to 14,171,627. The total is not small, but it is very unevenly distributed: the Gini coefficient by measurement count is 0.981, close to the 1.0 of complete inequality.
Choice of the Gini coefficient
The Gini coefficient was originally used to measure income inequality. It ranges from 0 to 1 and compresses the concentration of a whole distribution into a single number. 0 means perfectly even, with every link producing the same number of measurements. 1 means fully concentrated, with all measurements coming from a single link.
Each link's measurement count is a non-negative quantity, and the question is how concentrated all measurements are among a few links, which is what the Gini coefficient measures. Mathematically it equals the area between the Lorenz curve and the diagonal (divided by the total area below the diagonal), so the closer the Lorenz curve below hugs the bottom edge, the closer the coefficient is to 1. A value of 0.981 puts the distribution very close to the extreme where a handful of links take almost every measurement.
A single number does not show which links carry the volume or what the long tail looks like, so we include both the Lorenz curve and a bucketed distribution.
Lorenz curve of measurement volume (the dashed line is perfect equality)
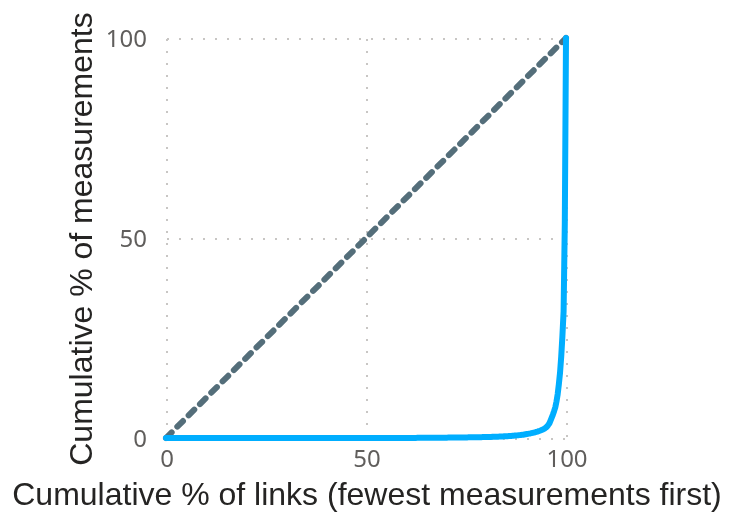
The Lorenz curve runs almost flat along the bottom and only shoots up at the very end. The 90% of links with the fewest measurements add up to just 0.93% of the total, and even the bottom 99% account for only 20.45%. The top 4 links take about 79.5%, and the single largest (DW's Global media, id 10006) is 46.5% on its own.
Which bucket each link's lifetime measurement count falls into
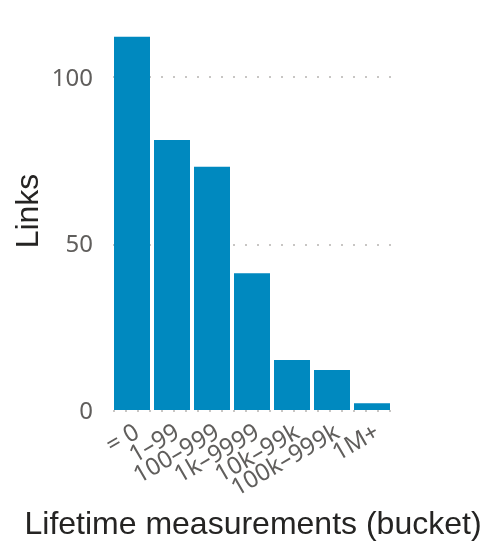
At the other end of the distribution, 112 of the 336 links (33%) have zero lifetime measurements, created and then barely run. 193 (57%) have fewer than 100, and the overall median is just 27. Most links were run a few times after creation and then left.
Measurement volume by use case
Grouping the links by list topic shows a common way of working among the most heavily observed cohorts.
Share of all measurements by use case (orange is the anoni.net community)
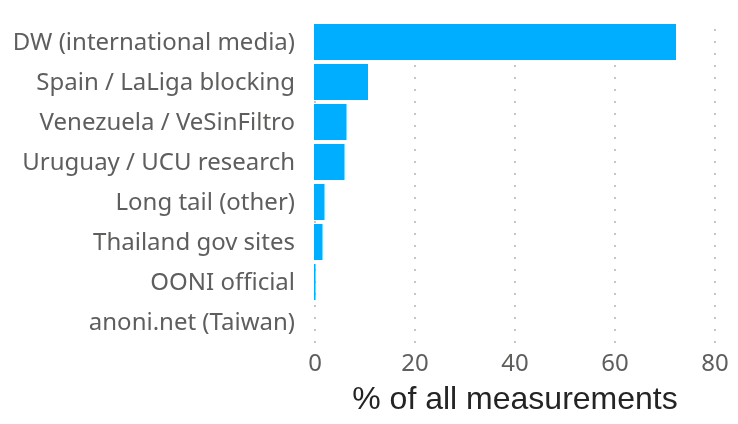
Deutsche Welle (DW) uses 3 lists to continuously monitor the reachability of international media in many places, taking 72.4%. Spain's conexionsegura uses 13 lists to watch the piracy blocks initiated by the LaLiga football league, at 10.8%. Venezuela's vesinfiltro uses 4 lists to track local blocking, at 6.5%. Next come Uruguay's UCU research team and an observer who has long tested Thai government websites. In each of these cohorts, every list targets one specific censorship or blocking phenomenon and a continuously running measurement backend executes it every day, which is the underestimated way to use Run v2.
The top 15 links by measurement count are in the table below.
| link id | Lifetime measurements | List size | Created | Author | List name |
|---|---|---|---|---|---|
10006 |
6,589,070 | 223 | 2024-07-03 | dw.com | Global media |
10005 |
3,093,765 | 91 | 2024-06-13 | dw.com | Selected (inter)national media |
10236 |
856,036 | 167 | 2026-05-14 | conexionsegura | La Liga bloqueos.es |
10158 |
734,627 | 4635 | 2025-04-03 | ucu (UY) | lista global final |
10004 |
582,480 | 15 | 2024-12-11 | dw.com | Trusted International Media |
10154 |
418,978 | 131 | 2025-03-26 | vesinfiltro | MagisTV y FlujoTV |
10135 |
344,268 | 819 | 2025-04-16 | conexionsegura | Test Bloqueos LaLiga |
10153 |
259,331 | 102 | 2025-03-24 | vesinfiltro | PriorityList |
10143 |
210,078 | 134 | 2025-03-05 | vesinfiltro | VSF News y otros |
10298 |
133,991 | 72 | 2026-05-04 | Thailand observer | Test Thai gov websites |
10226 |
118,509 | 170 | 2025-09-15 | conexionsegura | Bloqueos LaLiga - Dominios |
10235 |
109,276 | 293 | 2025-09-20 | conexionsegura | VE media http+https check |
10214 |
105,439 | 67 | 2025-10-04 | Thailand observer | Test Thai gov websites |
10114 |
102,096 | 256 | 2026-05-05 | jiyul.org | revi |
10118 |
56,541 | 3044 | 2025-03-26 | ucu (UY) | LISTA GLOBAL |
List size and lifetime measurements
Intuitively, a list with more sites should produce more data, but plotting each link's list size (number of inputs) against its lifetime measurements shows almost no relationship.
List size vs lifetime measurements (orange = anoni.net's two links; 2 links with 0 inputs are dropped by the log axis)
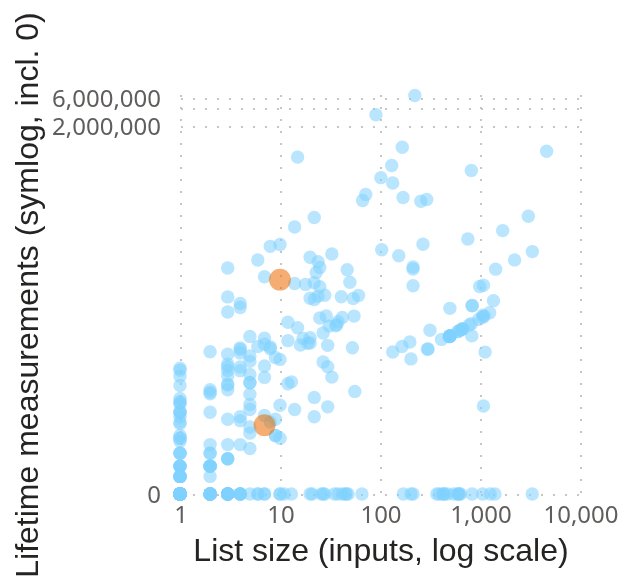
UCU's 10158 holds 4,635 inputs (the largest on the network) and has 734,627 lifetime measurements. DW's 10004 has only 15 inputs yet 582,480 measurements. However big a list gets, without a continuously running backend to execute it the measurement count stays near 0 and no observation is happening. Observation accumulates when some measurement infrastructure runs the list every day; how many sites it holds matters far less.
The anoni.net community's two links
The anoni.net community has created two Run v2 links, which happen to match the two patterns above. We list both, not just the better-performing one.
The first, 10238, was created on 2025-09-15 with 7 inputs (anoni.net plus our own services: im, matrix, form, pad, search, cinny) and has only 14 lifetime measurements. It belongs to the majority that were created but never run continuously.
The second, 10328, was created on 2026-05-15 with the list expanded to 10 inputs, and a self-operated vantage point runs it continuously. In half a month it accumulated 4,659 measurements, ranking 39th of 336 and inside the top 12%.
Same community, same draft list of our own services; the only difference between the two links is whether a continuously running backend stands behind them. 10328's share of the whole network is still near 0%, but in a distribution with a tail this long, running continuously for half a month already puts it ahead of 297 links. Most links never cross the threshold of continuous operation.
Implications for communities and OONI
For communities that want to run local connectivity observation, Run v2's value comes from a curated list aimed at a specific phenomenon plus a continuously running measurement backend. Missing either one puts a link in the long tail, and opening more links brings no data by itself.
DW, conexionsegura and vesinfiltro already apply the pattern to international media reachability, sports-piracy blocking and local blocking. The same pattern fits other topics, including the following.
- Election observation: track the reachability of news media, candidate and election-authority websites in a given region from before to after an election, recording any blocking or interference during the voting period and giving election observers and researchers an evidentiary time series.
- Real-time observation of major events: during protests, strikes, disasters or shutdowns, test independent media, messaging services (Signal, Telegram) and help-and-information sites continuously, to see which are blocked and from when.
- Specific communities and issues: observe sites that are often blocked in some regions, such as those of LGBTQ+ groups, religious minorities, women's rights groups and human-rights organizations, over the long term to build evidence that research can cite.
- Circumvention-tool availability: track whether the official sites and download locations of VPNs, Tor, bridges and other circumvention tools are still reachable in a given place and when blocking begins, which is especially useful for groups helping local people stay connected.
- Cross-border media and diaspora communities: observe the overseas media that diaspora communities rely on (for Chinese-language readers, for example RFA or Initium Media) for reachability differences across ASNs and changes over time.
- Platform-level blocking events: when an app or service is suddenly blocked in a country, quickly create a list and observe across ASNs, measuring the scope and the start and end times of the block and leaving data that can be analyzed.
Pick the topic you care about most, list a dozen or so relevant sites, and have one vantage point run the list every day; within a few weeks you will have your own reachability time series to analyze.
The OONI team and data analysts can use the aggregation API's ooni_run_link_id filter to run a meta-analysis of how Run v2 as a whole is used. This report was produced that way.
Data and caveats
The data in this report is a snapshot taken on 2026-06-01, pulled link by link from OONI's public aggregation API1 (filtered by ooni_run_link_id). Measurement counts keep growing, so a later query yields slightly higher numbers, while the shape of the concentration stays stable. Caveats for reading the figures:
- Measurement counts come from the aggregation API's
measurement_count, queried as of 2026-06-01, and keep growing afterwards. - The lifetime query spans
2024-01-01to2026-06-30, covering the whole history of Run v2. - A link with 0 measurements may be a test or a draft, and does not necessarily mean failure.
- Probes in any country can run any link; the use-case cohorts are inferred from list topic and are not an official OONI label.
- Full disclosure: both of the community's own links (
10238,10328) are included in the analysis and discussion; we did not pick only the better-performing10328.