OONI Measurements of Northern Taiwan's 30-Minute Mobile Throttle on 13 August
Taiwan has long gone without large-scale throttling or shutdowns, which leaves anyone trying to understand network anomalies there without a local sample to compare against. In the public database of OONI (Open Observatory of Network Interference), Taiwan's record has consistently shown a network working normally.
In the 30 days before 13 August, the three mobile carriers in Taiwan recorded 564 successful connection speed tests (the test is named ndt), with a median download of 12,425 kbit/s. Only 4 measurements fell below 2,000 kbit/s, and two of those were failures (1,000 kbit/s is roughly 1 Mbps).
From 14:30 to 15:00 Taipei time on 13 August, mobile networks across seven northern counties were throttled for 30 minutes. Two days earlier the community put out a call asking people to run OONI Probe's performance tests during that window. Taiwan recorded 238 connection speed tests and 235 video streaming tests (named dash) that day, with 170 and 168 of them completed on mobile networks, coming from 47 devices. During the equivalent window at the central Taiwan drill on 10 August, the whole country produced zero mobile performance measurements.
The call started with a proposal from community member mashbean to use the drill as a rare measurement opportunity. The work was then split: the community wrote the call and the operating instructions, and he observed in the field on the day. He wrote his own record up as a separate post, which follows the network past the announced end of the drill and covers a period this dataset cannot see.
Among the 47 devices, one Chunghwa Telecom Mobile handset measured 788 to 1,709 kbit/s during the throttle, figures of an order Taiwan's public data had never shown. They come from 6 records left by a single device: enough to stand as one complete case, not enough to generalise to the country or to any carrier.
This post records network conditions only. Whether carriers followed instructions precisely, and whether the officially published figure is accurate, are both outside its scope. Taiwan had no data on what throttling looks like, and preserving these 30 minutes is the point. Every query below works without authentication or an API key, so readers can run them again.
The most useful result of the analysis is a reading method: throttling and blocking produce completely different shapes in OONI data. Blocking sends anomaly rates up and leaves confirmed-blocking records behind, while throttling leaves the verdict fields untouched and shows up only in throughput and latency values. Taiwan's web connectivity anomaly rate that day was 1.0%, in the same band as the usual 0.6%, with confirmed blocking at 0 all day. Only speed went down. Describing a throttle through blocking anomaly rates returns a figure close to normal, and leads to the conclusion that nothing happened.
The overall shape of that day's data
Grouping every connection speed test in Taiwan that day into 15-minute buckets shows the community mobilisation directly.
Connection speed tests per 15-minute interval on 13 August, orange marks the throttle window
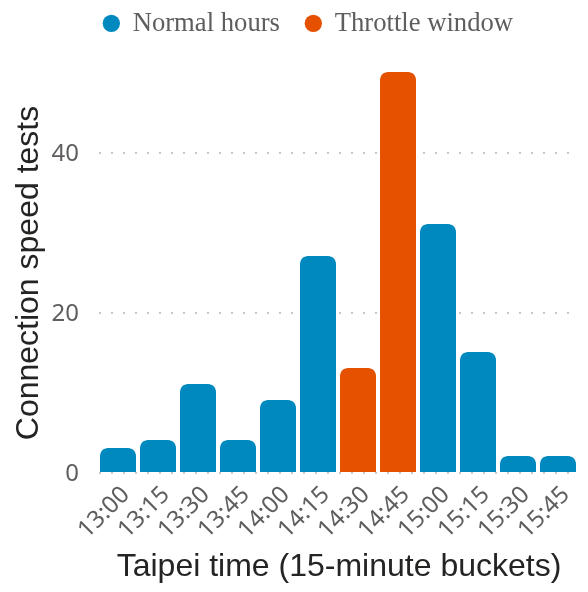
The call asked people to set an alarm for 14:35, and to add 14:15 and 15:10 if they had time. All three peaks show up, with the 50 measurements between 14:45 and 15:00 the highest point of the day. Over the previous 30 days Taiwan averaged about 34 connection speed tests per day, mostly from a handful of devices on automatic schedules. A single 15-minute bucket that afternoon beat a normal full day.
Full counts per 15-minute interval
| Taipei time | Measurements |
|---|---|
13:00 to 13:15 |
3 |
13:15 to 13:30 |
4 |
13:30 to 13:45 |
11 |
13:45 to 14:00 |
4 |
14:00 to 14:15 |
9 |
14:15 to 14:30 |
27 |
14:30 to 14:45 |
13 |
14:45 to 15:00 |
50 |
15:00 to 15:15 |
31 |
15:15 to 15:30 |
15 |
15:30 to 15:45 |
2 |
15:45 to 16:00 |
2 |
OONI records only down to the ASN and never the user's location. Device counts in the table below are deduplicated by the anonymous device identifier (probe_id) that OONI generates.
| Carrier | 13 Aug | Previous 30 days | Devices that day |
|---|---|---|---|
AS17421 Chunghwa Telecom Mobile |
68 |
20 |
22 |
AS9674 FarEasTone |
51 |
12 |
15 |
AS24158 Taiwan Mobile |
55 |
538 |
9 |
All three numeric columns count connection speed tests. The first two are measurement counts, the last is distinct devices: one phone testing three times counts as 3 measurements and 1 device.
Chunghwa Telecom Mobile and FarEasTone were the two thinnest carriers in Taiwan's OONI record, and one afternoon exceeded what each had accumulated over the previous 30 days. Taiwan Mobile's 30-day count was already high, driven by a few devices running on long-term automation, so the 9 devices that day represent a distribution that did not exist before.
The data cannot tell who measured because of the call. The performance test in the app is a built-in card (numbered 00107), and every user worldwide runs the same one; over a thousand measurements carried that number outside Taiwan on the same day. The effect of the call can only be estimated from before-and-after volume.
Before and after on a single device
The device identifier makes it possible to string together every measurement from the same phone. One Chunghwa Telecom Mobile Android handset ran tests both before and during the throttle, leaving 6 records for each of the two performance tests.
Download and upload throughput from a single handset. The grey band marks the throttle window, the vertical axis is logarithmic, and the data spans more than two orders of magnitude. Nothing was measured between 13:33 and 14:36, so the line breaks there
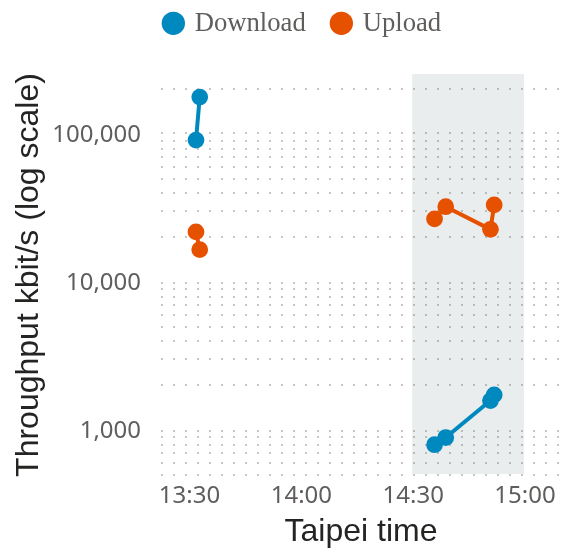
The two download segments sit two orders of magnitude apart. The two upload segments sit at almost the same height.
The first two records come from about an hour before the throttle began, the last four from inside the window. The median download fell from 132,096 kbit/s to 1,223 kbit/s, and the two tests independently produce ratios of 1/108 and 1/88. Across 18 measurements in the previous 30 days, Chunghwa Telecom Mobile's lowest value was 42,197 kbit/s, so the 788 kbit/s recorded during the throttle is an order that carrier had never shown in public data.
The same measurements also record round-trip time and retransmission rate. All six in full:
| Taipei time | Download | Upload | Streaming bitrate | Min RTT | Avg RTT | Retransmit |
|---|---|---|---|---|---|---|
13:32 |
89,510 |
21,510 |
138,513 |
18.39 |
66.78 |
0.000% |
13:33 |
174,682 |
16,348 |
119,179 |
17.85 |
82.05 |
0.001% |
14:36 |
788 |
26,300 |
1,308 |
16.85 |
168.40 |
0.522% |
14:39 |
881 |
31,789 |
1,608 |
19.97 |
137.24 |
0.202% |
14:51 |
1,565 |
22,370 |
1,624 |
18.72 |
130.05 |
0.000% |
14:52 |
1,709 |
32,695 |
821 |
18.28 |
114.79 |
0.000% |
The first three numeric columns are in kbit/s; 1,308 kbit/s corresponds roughly to standard-definition streaming. The two RTT columns are in milliseconds. Minimum RTT takes the quickest round trip across the whole test and approximates the path itself, while average RTT also absorbs any queuing along the way. The retransmission rate is the share of packets that had to be sent again.
The connection speed test terminates at an M-Lab server, so the throughput figure covers both the last mile and the international leg to that server, and a single result cannot separate the two. The latency fields address that concern. Minimum RTT held between 17 and 20 ms throughout, consistent with an unchanged packet path, which makes it less likely the speed change originated on the international leg. Average RTT rose from 67 to 82 ms up to 115 to 168 ms, indicating packets queuing somewhere. The retransmission rate rose in two of the four throttled records, from near 0 to 0.522% and 0.202% — a large relative change, though the absolute value stayed under 0.6%, which fits delayed delivery rather than heavy discarding.
Taken together, the three fields match the signature of traffic shaping. Had the mechanism been packet dropping, the retransmission rate would have climbed far more sharply. Had the cause been signal degradation or a cell handover, minimum RTT would usually have moved with it. This reading, too, rests on a single device.
The Executive Yuan (Taiwan's cabinet) described the method as core-network rate limiting, capping mobile download speed at 256KB2. The original wording does not state a unit. Read as 256 KB per second it converts to 2,048 kbit/s. Read as 256 kbit/s it would be an entirely different order. This post makes no numerical comparison against that figure and cites it only to show the magnitude that was announced.
Comparison measurements without a throttle signal
Of the 47 devices, 46 measured normal speeds during the window. Across the three mobile carriers, the median download was 53.2 Mbps before the throttle, 42.2 Mbps during it, and 58.5 Mbps after, all in the same band.
With a whole batch of normal figures as the baseline, a single device's 788 kbit/s can be identified as the exception. Had everyone measured low speeds that day, the reasonable reading would be a nationwide slowdown or ordinary variation. Had only one phone been measuring, the low figure could equally have come from that handset's own situation, such as poor signal or a background app consuming bandwidth. With 32 devices running the same tests in the same window and 31 of them normal, a single device's anomaly holds up.
That is why the call asked people outside the throttled area to measure as well: whether the figures from inside the area can be read at all depends on the measurements from outside it. Someone in Tainan, in Kaohsiung, or not in Taiwan at all could take part. A run at the same moment lands in the same public database and becomes part of the comparison.
Thousands of identical performance tests ran worldwide that day. What sets Taiwan's apart is that they map onto a known event with sharp time boundaries.
The experience on a phone, mapped onto data fields
No experience survey was run, so the four situations below are worked backwards from the data.
Video buffering
The streaming test records how long playback waits before it starts. Both records before the throttle show 0 seconds; the three during it show 0.12, 0.12, and 5.29 seconds. That last one waited more than five seconds before playing, the time spent watching a loading spinner after tapping a video.
Uploads unaffected
The four uploads during the throttle measured 26,300, 31,789, 22,370, and 32,695 kbit/s, no lower than the 21,510 and 16,348 kbit/s recorded before it. Upload ran 33, 36, 14, and 19 times faster than download, and the rate limiting applied only downstream. The call had warned that uploads might fail during the throttle; in practice, measurement results went out immediately, with no need to wait for the network to recover.
Delay between a tap and a response
Average RTT doubled, which stretches the gap between every tap and the screen responding.
Web pages slow but still loading
Taiwan recorded 1,893 web connectivity measurements during the window, with an anomaly rate of 1.0% against 0.6% both before and after. Confirmed blocking was 0 in every window. Websites were reachable, and so were Tor and Psiphon: the 33 Tor tests and 33 Psiphon tests during the throttle all returned zero anomalies.
Throttling and shutdowns in the data
Most OONI tests perform a blocking verdict, among them web connectivity, Telegram, and Signal. When real blocking or a shutdown occurs, anomaly rates climb and confirmed-blocking records appear. In severe cases measurements fail outright and reports never leave the device, leaving a gap in the database. Under throttling every connection succeeds, reports upload as usual, and the verdict fields do not move.
| Blocking or shutdown | Throttling | |
|---|---|---|
| Connections | Many fail | All succeed |
| Anomaly rate | Rises clearly | Unchanged |
| Confirmed blocking | May appear | Stays at 0 |
| Throughput | Not necessarily affected | Drops clearly |
| Which tests to read | Tests with blocking verdicts | Values from performance tests |
To observe throttling, read the values from performance tests; to observe blocking, read the tests that carry verdicts. Reading the wrong set produces numbers that point at the wrong conclusion.
The call asked only for performance tests for the same reason. Running verdict-bearing tests under a rate limit means the handset times out repeatedly while the test helper server behaves normally. The comparison then gets flagged with the signature of blocking, injecting a batch of censorship-looking records into Taiwan's public data. No such false signal appeared in that day's data.
Both shapes can be inspected directly. In Taiwan's hourly breakdown for 13 August, confirmed blocking holds at 0 all day, including the throttled hour. Blocking events verified by the OONI team are collected in Findings, each linked to its underlying measurements, where confirmed-blocking counts can be seen climbing during an event.
Steps from the public data to each conclusion
Step one, measurements in a time range
The measurements endpoint needs no authentication and accepts a range specified to the second.
https://api.ooni.org/api/v1/measurements?probe_cc=TW&test_name=ndt
  &since=2026-08-13T06:00:00Z&until=2026-08-13T08:00:00Z&limit=200
All times are UTC; Taipei time is 8 hours ahead, so the throttle window is 06:30 to 07:00. To capture a full day in Taipei time, shift both bounds back 8 hours, giving 2026-08-12T16:00:00Z to 2026-08-13T16:00:00Z. Every record returned carries a network number (probe_asn) and a measurement id (measurement_uid). When the count exceeds limit the response includes next_url, and every page has to be fetched or data goes missing. There were 238 connection speed tests that day, more than a single limit=200 returns.
Step two, values in the raw JSON
The listing itself carries no throughput figures, so each measurement_url has to be fetched. Connection speed test values live under test_keys.summary, covering download (download), upload (upload), minimum round-trip time (min_rtt), average round-trip time (avg_rtt), and retransmission rate (retransmit_rate). Streaming test values live under test_keys.simple, covering median bitrate (median_bitrate) and playback wait (min_playout_delay).
Step three, the mobile network filter
The network type field in the raw JSON (annotations.network_type) marks mobile (mobile), Wi-Fi (wifi), wired (wired_ethernet), or VPN (vpn). Of the 238 connection speed tests that day, only 170 were marked mobile. Without that filter, home fibre and VPN measurements mix in, and neither was inside the throttled area to begin with.
Step four, grouping by device identifier
The identifier sits at the top level of the raw JSON under probe_id, a sibling of test_keys rather than something inside it. Its value is an anonymous hash OONI generates per device, and every measurement from the same phone carries the same value, so collecting matching values reconstructs that device's full record for the day. Of the 238 connection speed tests that day, 18 carry no identifier, cannot be attributed to any device, and are excluded from the device counts here.
Handset model, location, and signal strength all differ, so a single measurement is hard to read on its own. One phone compared against itself is far more direct, and the six-record table above comes from exactly that.
Step five, false positives
Two cases came up on the day.
A Taiwan Mobile device measured 3,124 kbit/s at 14:54, which looks like throttling. But it measured 3,126 kbit/s again at 20:11 the same day, and its streaming bitrate stayed between 2,072 and 2,909 kbit/s throughout. The figures are stable all day and come from that subscription's own speed cap, unrelated to the drill. Looking only at the throttle window, it would easily have been counted as evidence.
Another 5 measurements failed outright during the window, with connection timeouts, a DNS lookup failure, and a refused connection. The cause of a failure cannot be determined from a single result — it might come from the throttle, or from ordinary connection trouble — so none are included.
Step six, the comparison group
During the same window on 10, 11, and 12 August, not one mobile performance measurement fell below 2,000 kbit/s; the lowest of the 7 taken on 12 August was 8,399 kbit/s. Measurements below 2,000 kbit/s appear only in the throttle window on 13 August, and nowhere else that day. Only with a comparison group can an observed low speed be separated from ordinary variation.
Questions outside this dataset
Location
OONI records country and ASN, never counties and never cell tower locations. The data shows that a measurement came from AS17421; it cannot show whether the phone was in Taipei or Tainan. Only 1 of the 47 devices left a clear throttle signal, and the most likely explanation is that the others were outside the seven affected counties, which the public data cannot verify.
Omitting location is a deliberate OONI design choice made to protect participants, since in countries with heavy censorship a measurer's location translates directly into personal risk. The trade-off is sound, and the cost is that events with sharp geographic boundaries are hard to align precisely. Adding a location dimension requires the community to collect it separately, for instance through a voluntary county-level form. Such a form would record nothing finer than the county and never be joined to device identifiers, so it does not reconstruct the tracking capability OONI deliberately removed.
Coverage across carriers
The devices with a complete before-and-after record cluster on Chunghwa Telecom Mobile. For Taiwan Mobile and FarEasTone, the low values during the window were all measurement failures, leaving nothing readable. That gap comes from where participants and measurements happened to fall, and says nothing about differences between the carriers' networks. Seeing how different carriers behaved in the same window would require each of them to have devices completing measurements before, during, and after.
Recovery time
The handset with the complete throttle record took its last measurement at 14:52, so the before-and-after comparison in this post ends there. The 30 minutes after the window contain 38 measurements, all from devices that showed no throttle signal, which leaves no single device spanning both.
The public data does hold a trace of the recovery period, and this post's own filter excluded it. A Taiwan Mobile device measured 55 kbit/s at 15:08, and its streaming test two minutes later returned 0 — both after the announced end of the drill. The network type field is empty on both, and this post counts only measurements explicitly marked as mobile in order to exclude fixed-line and VPN results, so neither entered the statistics. The filter that removes noise removed the signal along with it.
That period is covered by mashbean's field observation. He recorded downloads still at 55 kbit/s at 15:08, streaming tests moving from timeout to completion, and usable service only returning at 17:47. From that record he argues that restoration time belongs among the criteria for evaluating a resilience exercise, with functional recovery and a return to baseline judged separately. Whose hand the device was in, whether it was really on a mobile network, which county the person was standing in: the dimensions OONI does not record are the ones only the measurer can supply.
The chart below lays both sets of observations on one timeline.
Timeline of that afternoon, with the grey band marking the announced throttle window and rows grouped by source
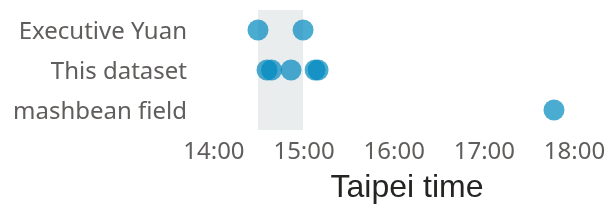
The announced end was 15:00, the last low-speed record lands at 15:08, and usable service returned at 17:47. The longest empty stretch on the chart lies between the last two, and nearly three hours separate the announced end from recovery.
Full event list for the timeline
| Taipei time | Event | Source |
|---|---|---|
14:30 |
Announced start of throttling | Executive Yuan |
14:36 |
Single device measures 788 kbit/s, lowest of the day |
This post |
14:39 |
Same device at 881 kbit/s, upload still 31,789 |
This post |
14:52 |
Same device's last record, 1,709 kbit/s |
This post |
15:00 |
Announced end of throttling | Executive Yuan |
15:08 |
Another device still measures 55 kbit/s |
This post and mashbean |
15:10 |
Same device's streaming test returns 0 |
This post and mashbean |
17:47 |
Usable service returns | mashbean's field observation |
How much one device can represent
What this post says about the direction and layer of the rate limiting rests on 6 measurements from one handset. The figures are internally consistent and two independent tests point the same way, which makes it a complete record of a single case. Distributions, average magnitude, or confidence intervals would need far more samples than that.
The 47 devices are also community members who volunteered after seeing the call, not a random sample. Any inference across carriers or regions would have to account for that selection bias first.
Entry points to OONI's public data
Nothing unusual was needed for this analysis; all of the data comes from public APIs. OONI's data has four entry points, each suited to different work.
- OONI Explorer: a web interface for looking up individual measurements or trends by country and ASN, no programming required.
- Aggregation API:
https://api.ooni.org/api/v1/aggregation, no authentication or key, with breakdowns by country, test, and ASN. Its bounds accept dates only, which suits trends at day granularity and above. - Measurements API:
https://api.ooni.org/api/v1/measurements, accepts ranges specified to the second and returns individual records. Most of the data here comes from this endpoint. - AWS S3 public dataset:
ooni-data-eu-fra, raw JSON per measurement, suited to inspecting measurement internals or running large-scale analysis. Access patterns and CSV output are documented in ASN coverage data collection and analysis, along with the community-maintained fetcher.
People who do not write code can take part too. Install OONI Probe and run it, and every measurement enters the public database. Taiwan averaged only 34 connection speed tests per day over the previous 30 days, so one more phone measuring routinely makes the baseline more complete. Whether an unexpected slowdown can later be told apart from a problem at your own end depends on how much has been accumulated beforehand.
The long-term baseline for Taiwan's mobile networks remains thin, with coverage across the three carriers differing by one to two orders of magnitude; the details are in ASN coverage analysis of OONI data. To work out which test suits a given question, the OONI test reference lists what each test measures, its specification status, and whether Taiwan has data for it.
The most common misreading of this data is treating an anomaly as blocking. An anomaly only means a test did not complete as expected, which covers censorship, unstable networks, temporary ISP faults, and bugs in the test software. For the Tor test, countries without censorship such as Canada, Switzerland, and New Zealand also sit between 16% and 22%. Treating anomaly rates as blocking rates produces false accusations.
The exercise ran region by region and the northern drill was the last of the year, so the same conditions will not recur until next year. What was recorded is currently the only throttling data in Taiwan tied to a known scenario, which gives something to compare against the next time the network degrades unexpectedly.
To help work through the data, plan the next round of measurements, or ask anything about OONI's public data, join the discussion in the community Matrix Public Space.
Data and assumptions
Queried on 2026-08-14. Measurements continue to arrive late, so re-running these queries may return slightly higher counts. All dates are Taipei time, shifted back 8 hours when converted to the UTC the API expects. Parameters such as test_name are the literal values the API accepts, listed here so the queries can be reproduced.
Individual measurements for the day come from the measurements endpoint with probe_cc=TW, since=2026-08-12T16:00:00Z, and until=2026-08-13T16:00:00Z, covering all of 13 August in Taipei time, with test_name set to ndt, dash, web_connectivity, tor, and psiphon in turn. Per-window statistics such as the throttle window use a separate query covering UTC 06:00 to 07:30.
Throughput, round-trip time, and device identity come from the raw JSON of each measurement, retrieved through the measurement_url in the listing; field locations are given in the steps above. Mobile measurements here count only those with a network type of mobile, excluding Wi-Fi and VPN. Devices are deduplicated by probe_id, and measurements without that value are excluded from device counts. The per-carrier counts for the day cover all measurements on that ASN, matching how the 30-day baseline is calculated. After removing 2 VPN measurements and 3 with no network type, the counts completed on mobile networks are 67, 50, and 52. One of the 170 mobile measurements comes from AS9416, which is not one of the three nationwide carriers and is left out of the carrier table.
The 30-day mobile baseline (564 measurements, median 12,425 kbit/s, 4 below 2,000 kbit/s, Chunghwa Telecom Mobile's lowest at 42,197 kbit/s) comes from the measurements endpoint with probe_cc=TW, test_name=ndt, since=2026-07-13T16:00:00Z, and until=2026-08-12T16:00:00Z, covering 14 July to 12 August in Taipei time. probe_asn is set to AS24158, AS17421, and AS9674, again pulling raw JSON per measurement and dropping everything not on a mobile network.
Comparison days use the same measurements parameters with the date changed to 2026-08-10, 2026-08-11, and 2026-08-12, over UTC 05:30 to 07:30.
No individual device identifier is published here. The field does appear in OONI's public data, but writing out specific values would build an index into one participant's measurement history, which serves no purpose the measurements themselves require.
Details of the exercise follow the Executive Yuan announcement and the carriers' own notices1.
Sources: OONI measurements and aggregation APIs (query parameters above; measurement data licensed CC BY-NC-SA 4.0), ASN names from RIPEstat.